![[Stable]](figures/lifecycle-stable.svg)
Convenient function for calculating the median confidence interval.
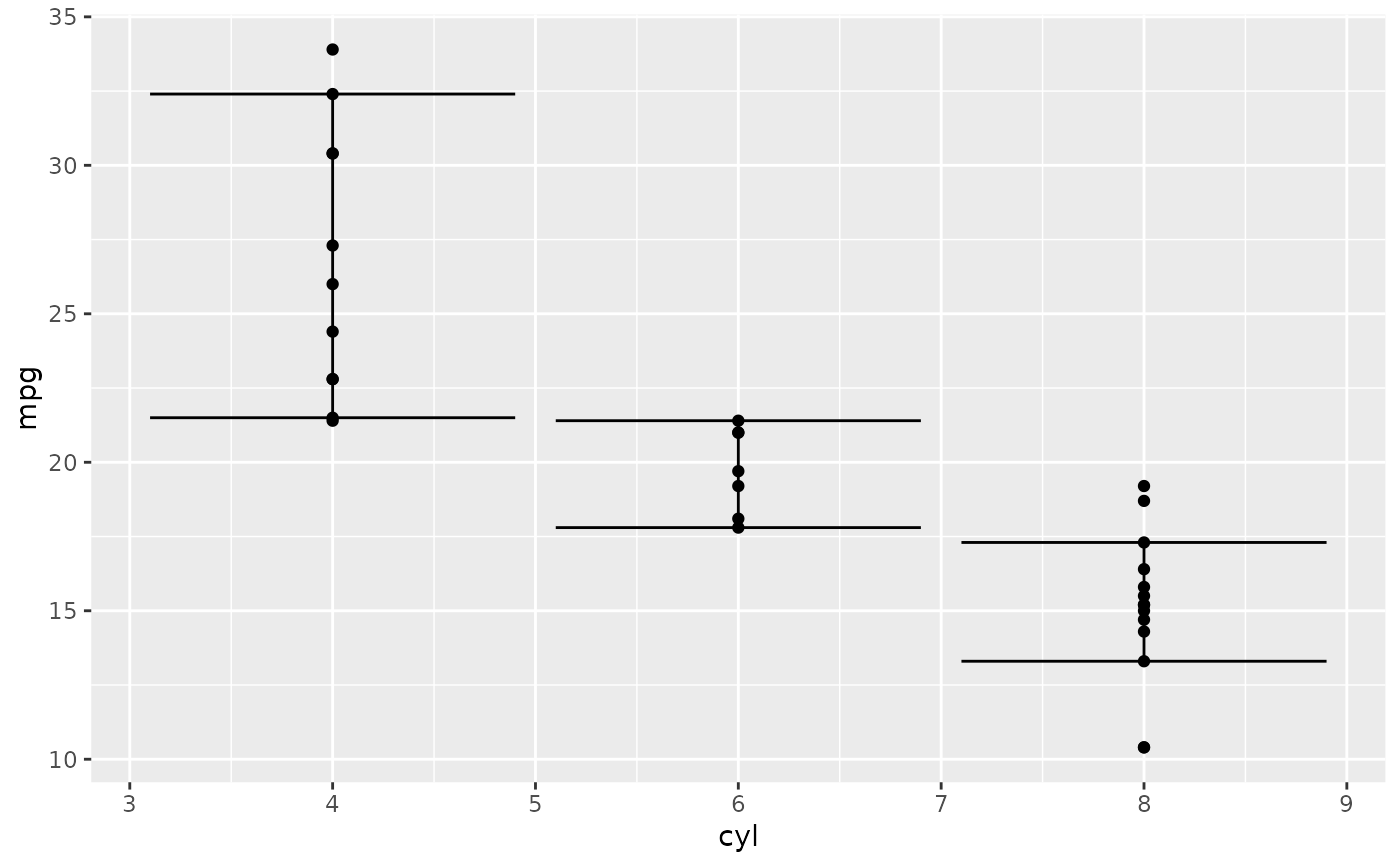
It can be used as a ggplot helper function for plotting.
Arguments
- x
(
numeric)
vector of numbers we want to analyze.- conf_level
(
proportion)
confidence level of the interval.- na.rm
(
flag)
whetherNAvalues should be removed fromxprior to analysis.- gg_helper
(
logical)TRUEwhen output should be aligned for the use withggplot.
Examples
stat_median_ci(sample(10), gg_helper = FALSE)
#> median_ci_lwr median_ci_upr
#>             2             9
#> attr(,"conf_level")
#> [1] 0.9785156

p <- ggplot2::ggplot(mtcars, ggplot2::aes(cyl, mpg)) +
  ggplot2::geom_point()
p + ggplot2::stat_summary(
  fun.data = stat_median_ci,
  geom = "errorbar"
)