![[Stable]](figures/lifecycle-stable.svg)
Convenient function for calculating the mean confidence interval.
It calculates the arithmetic as well as the geometric mean.
It can be used as a ggplot helper function for plotting.
Usage
stat_mean_ci(
  x,
  conf_level = 0.95,
  na.rm = TRUE,
  n_min = 2,
  gg_helper = TRUE,
  geom_mean = FALSE
)
Arguments
- x
(
numeric)
vector of numbers we want to analyze.- conf_level
(
proportion)
confidence level of the interval.- na.rm
(
flag)
whetherNAvalues should be removed fromxprior to analysis.- n_min
(
number)
a minimum number of non-missingxto estimate the confidence interval for mean.- gg_helper
(
logical)TRUEwhen output should be aligned for the use withggplot.- geom_mean
(
logical)TRUEwhen the geometric mean should be calculated
Examples
stat_mean_ci(sample(10), gg_helper = FALSE)
#> mean_ci_lwr mean_ci_upr
#> 3.334149 7.665851
p <- ggplot2::ggplot(mtcars, ggplot2::aes(cyl, mpg)) +
ggplot2::geom_point()
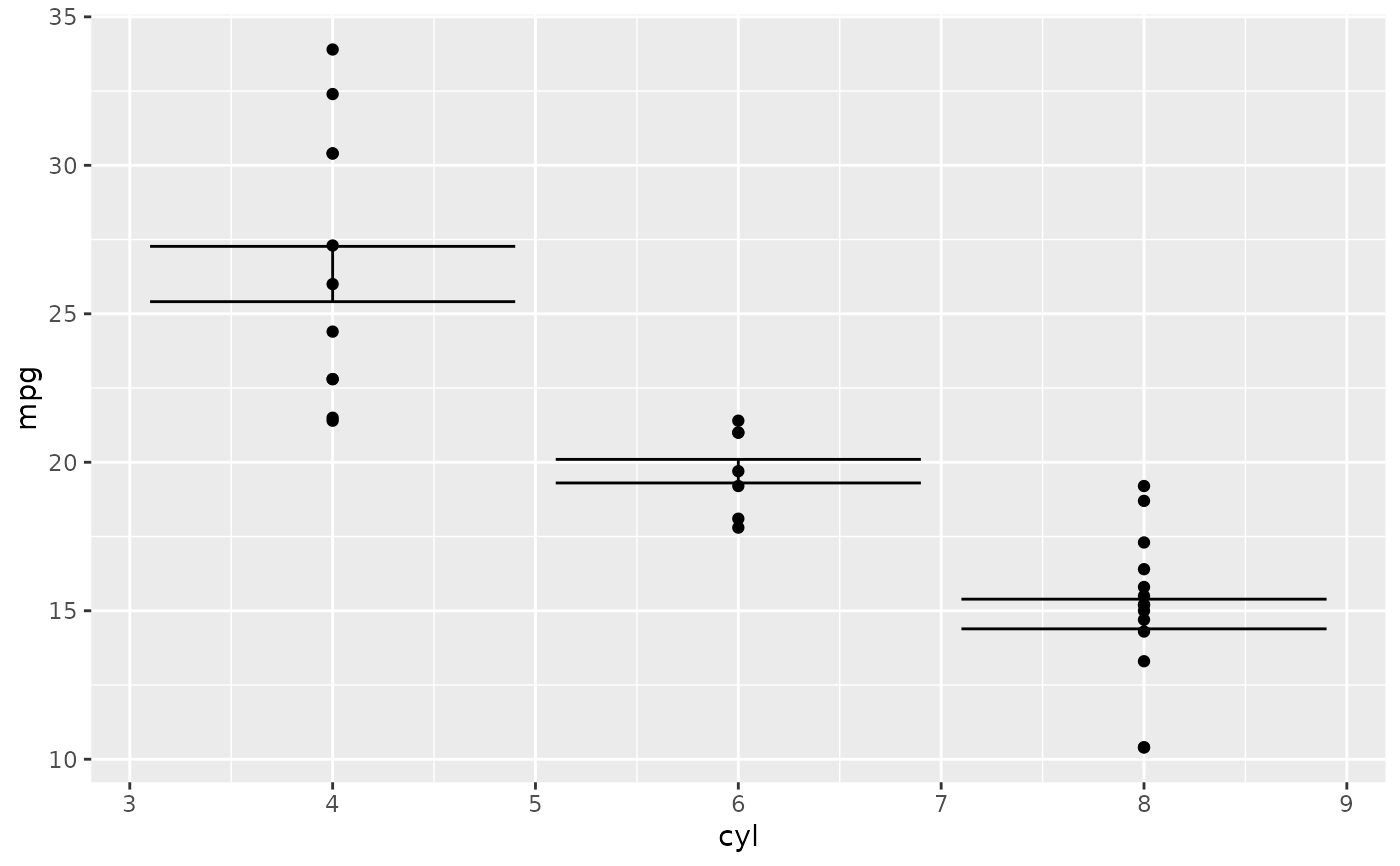
p + ggplot2::stat_summary(
fun.data = stat_mean_ci,
geom = "errorbar"
)
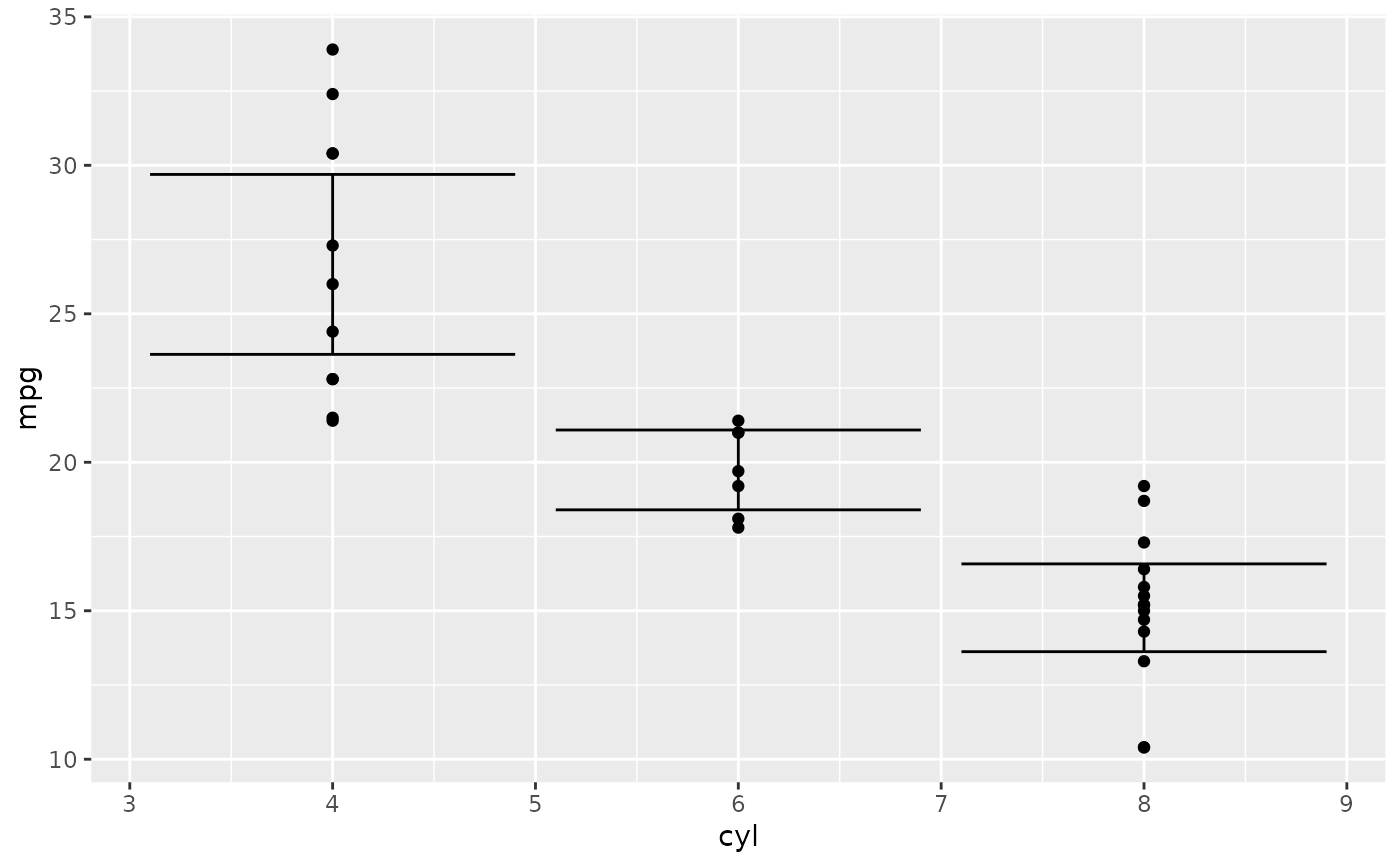 p + ggplot2::stat_summary(
fun.data = stat_mean_ci,
fun.args = list(conf_level = 0.5),
geom = "errorbar"
)
p + ggplot2::stat_summary(
fun.data = stat_mean_ci,
fun.args = list(conf_level = 0.5),
geom = "errorbar"
)
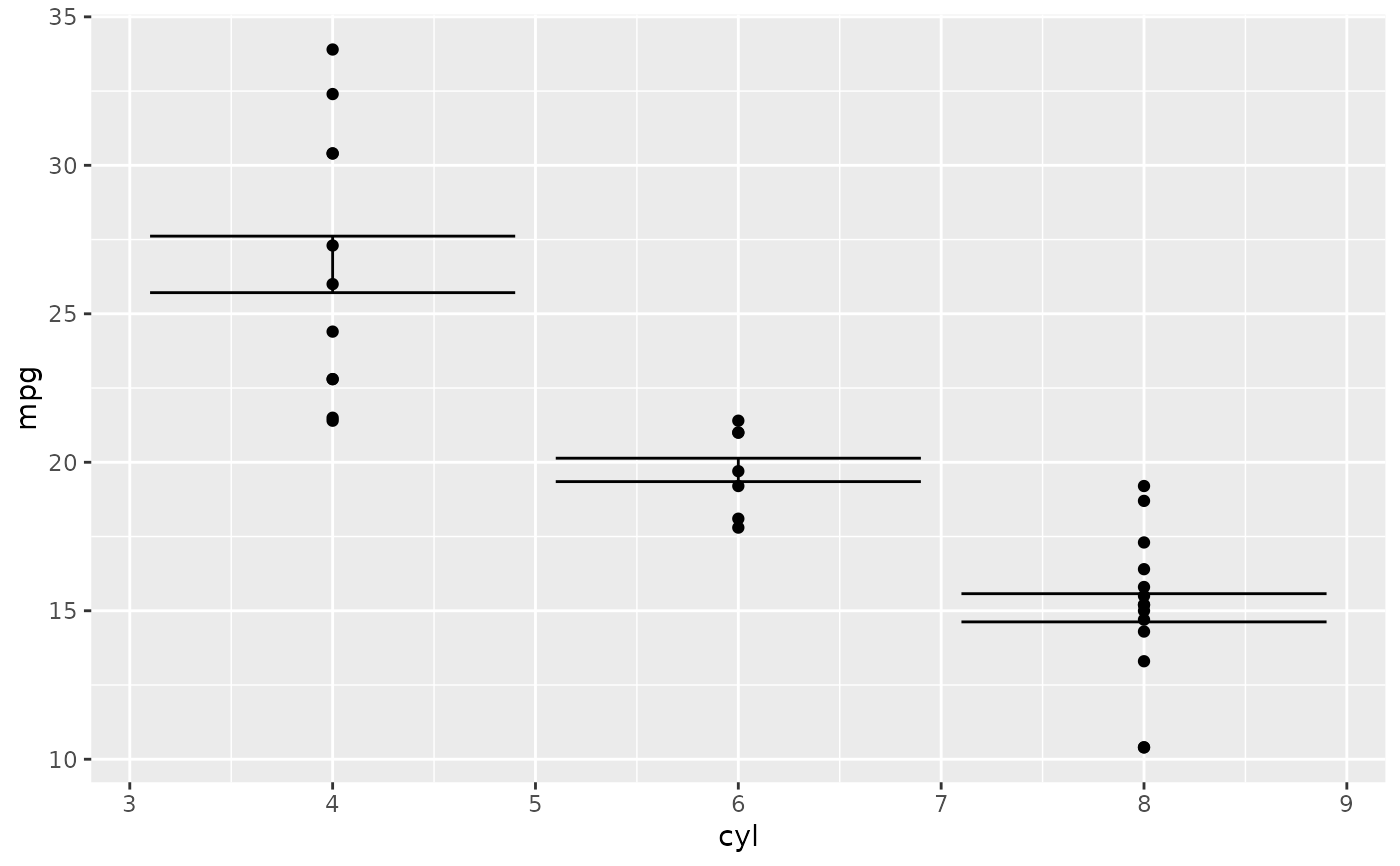 p + ggplot2::stat_summary(
fun.data = stat_mean_ci,
fun.args = list(conf_level = 0.5, geom_mean = TRUE),
geom = "errorbar"
)
p + ggplot2::stat_summary(
fun.data = stat_mean_ci,
fun.args = list(conf_level = 0.5, geom_mean = TRUE),
geom = "errorbar"
)