Add Titles, Footnotes, Page Number, and a Bounding Box to a Grid Grob
Source:R/decorate_grob.R
decorate_grob.Rd![[Stable]](figures/lifecycle-stable.svg)
This function is useful to label grid grobs (also ggplot2, and lattice plots)
with title, footnote, and page numbers.
Usage
decorate_grob(
  grob,
  titles,
  footnotes,
  page = "",
  width_titles = grid::unit(1, "npc"),
  width_footnotes = grid::unit(1, "npc") - grid::stringWidth(page),
  border = TRUE,
  margins = grid::unit(c(1, 0, 1, 0), "lines"),
  padding = grid::unit(rep(1, 4), "lines"),
  outer_margins = grid::unit(c(2, 1.5, 3, 1.5), "cm"),
  gp_titles = grid::gpar(),
  gp_footnotes = grid::gpar(fontsize = 8),
  name = NULL,
  gp = grid::gpar(),
  vp = NULL
)
Arguments
- grob
a grid grob object, optionally
NULLif only agrobwith the decoration should be shown.- titles
vector of character strings. Vector elements are separated by a newline and strings are wrapped according to the page with.
- footnotes
vector of character string. Same rules as for
titles.- page
string with page numeration, if
NULLthen no page number is displayed.- width_titles
unit object
- width_footnotes
unit object
- border
boolean, whether a a border should be drawn around the plot or not.
- margins
unit object of length 4
- padding
unit object of length 4
- outer_margins
unit object of length 4
- gp_titles
a
gparobject- gp_footnotes
a
gparobject- name
a character identifier for the grob. Used to find the grob on the display list and/or as a child of another grob.
- gp
A
"gpar"object, typically the output from a call to the functiongpar. This is basically a list of graphical parameter settings.- vp
a
viewportobject (orNULL).
Details
The titles and footnotes will be ragged, i.e. each title will be wrapped individually.
The layout can be illustrated as follows:
Author
Adrian Waddell (waddella) adrian.waddell@roche.com
Examples
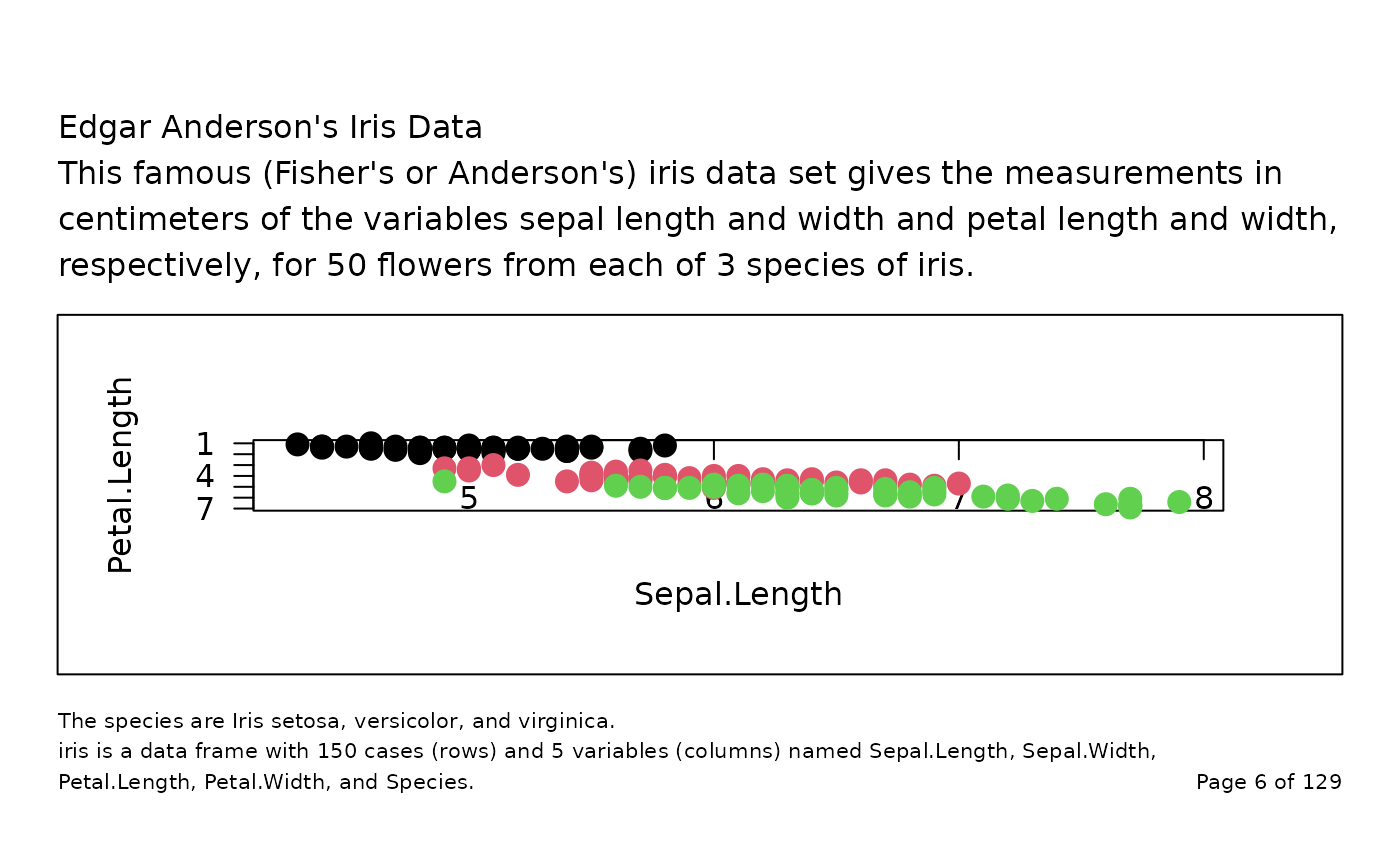
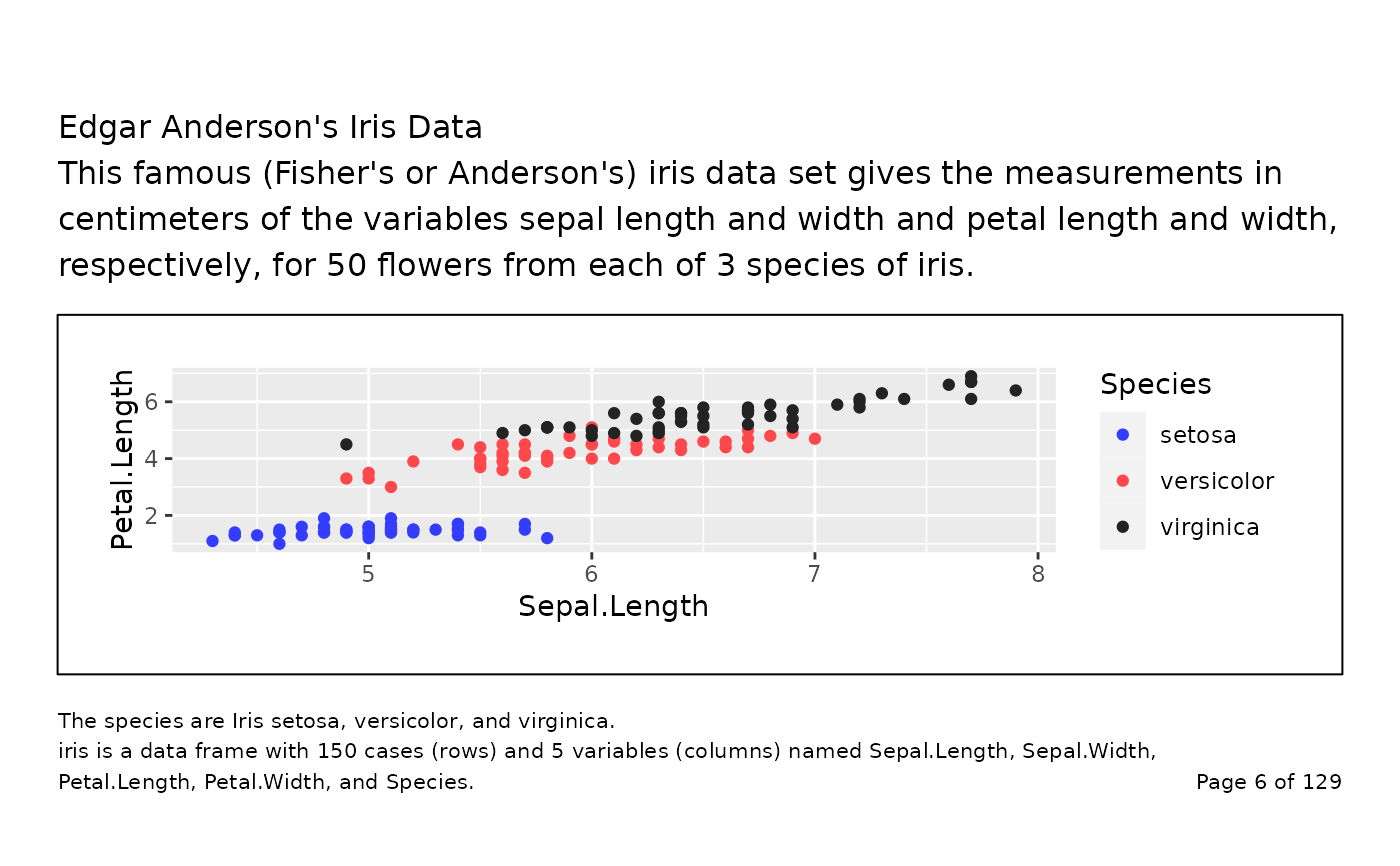
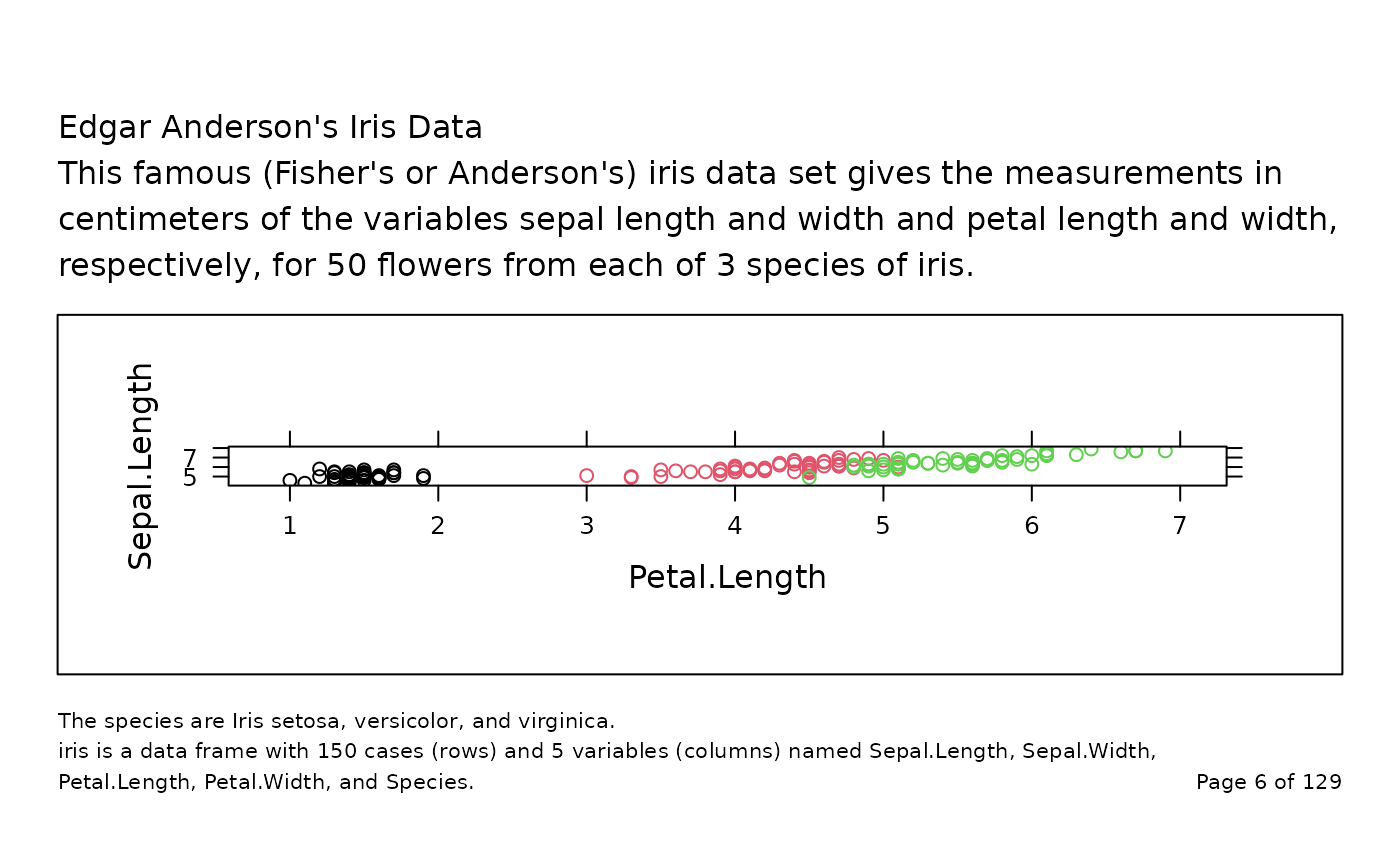
titles <- c(
"Edgar Anderson's Iris Data",
paste(
"This famous (Fisher's or Anderson's) iris data set gives the measurements",
"in centimeters of the variables sepal length and width and petal length",
"and width, respectively, for 50 flowers from each of 3 species of iris."
)
)
footnotes <- c(
"The species are Iris setosa, versicolor, and virginica.",
paste(
"iris is a data frame with 150 cases (rows) and 5 variables (columns) named",
"Sepal.Length, Sepal.Width, Petal.Length, Petal.Width, and Species."
)
)
## empty plot
library(grid)
grid.newpage()
grid.draw(
decorate_grob(
NULL,
titles = titles,
footnotes = footnotes,
page = "Page 4 of 10"
)
)
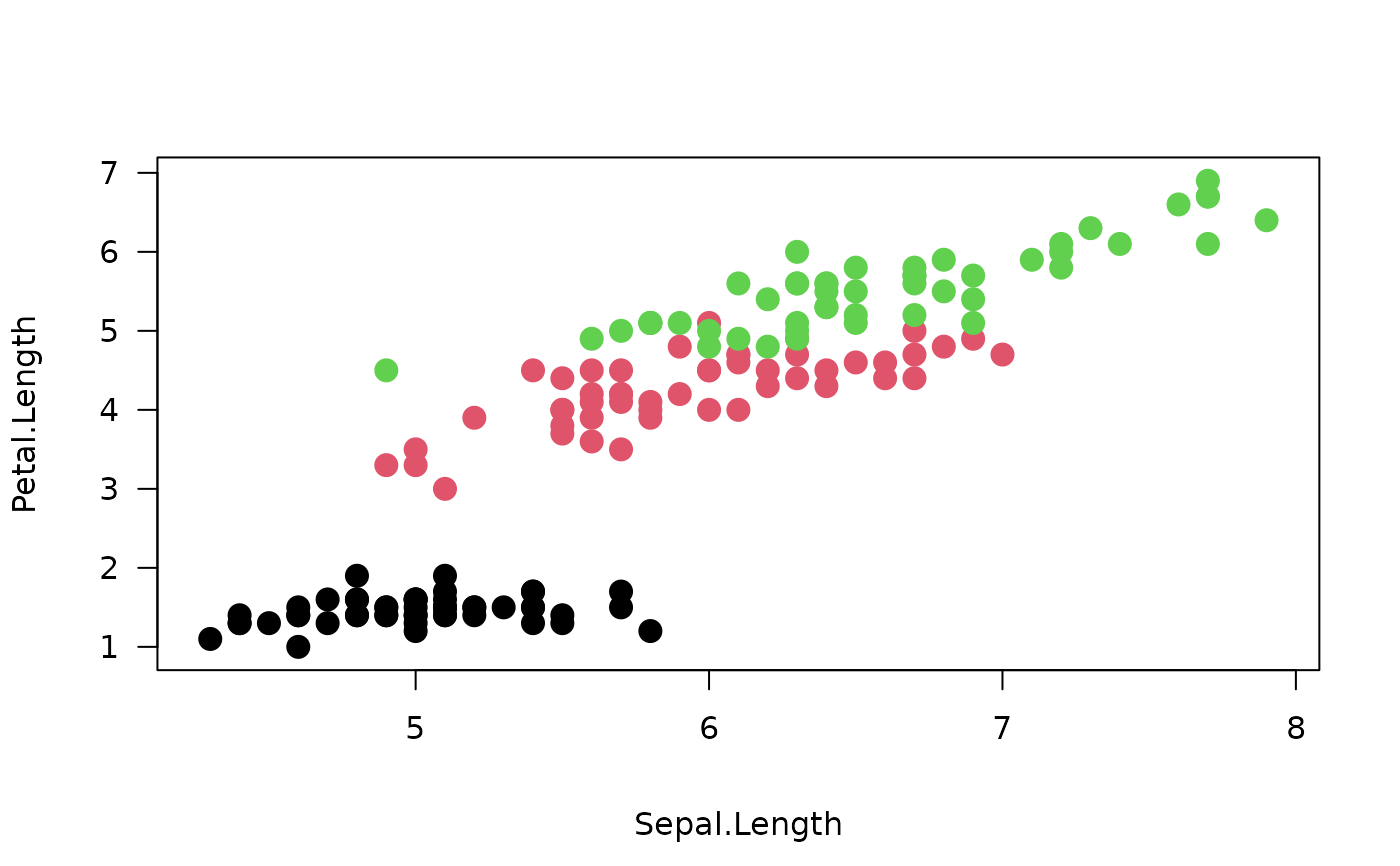
 # grid
p <- gTree(
children = gList(
rectGrob(),
xaxisGrob(),
yaxisGrob(),
textGrob("Sepal.Length", y = unit(-4, "lines")),
textGrob("Petal.Length", x = unit(-3.5, "lines"), rot = 90),
pointsGrob(iris$Sepal.Length, iris$Petal.Length, gp = gpar(col = iris$Species), pch = 16)
),
vp = vpStack(plotViewport(), dataViewport(xData = iris$Sepal.Length, yData = iris$Petal.Length))
)
grid.newpage()
grid.draw(p)
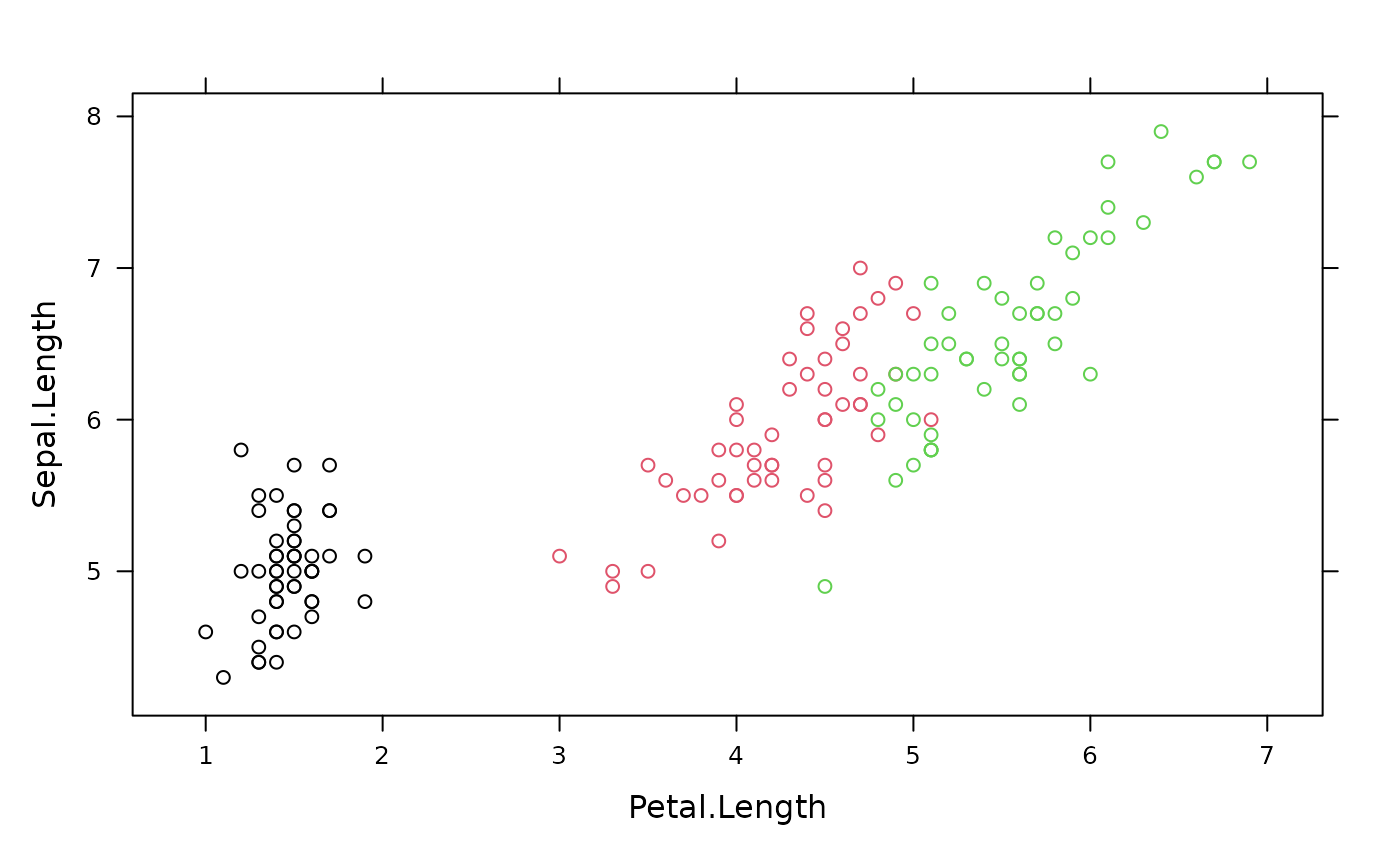
# grid
p <- gTree(
children = gList(
rectGrob(),
xaxisGrob(),
yaxisGrob(),
textGrob("Sepal.Length", y = unit(-4, "lines")),
textGrob("Petal.Length", x = unit(-3.5, "lines"), rot = 90),
pointsGrob(iris$Sepal.Length, iris$Petal.Length, gp = gpar(col = iris$Species), pch = 16)
),
vp = vpStack(plotViewport(), dataViewport(xData = iris$Sepal.Length, yData = iris$Petal.Length))
)
grid.newpage()
grid.draw(p)
 grid.newpage()
grid.draw(
decorate_grob(
grob = p,
titles = titles,
footnotes = footnotes,
page = "Page 6 of 129"
)
)
grid.newpage()
grid.draw(
decorate_grob(
grob = p,
titles = titles,
footnotes = footnotes,
page = "Page 6 of 129"
)
)
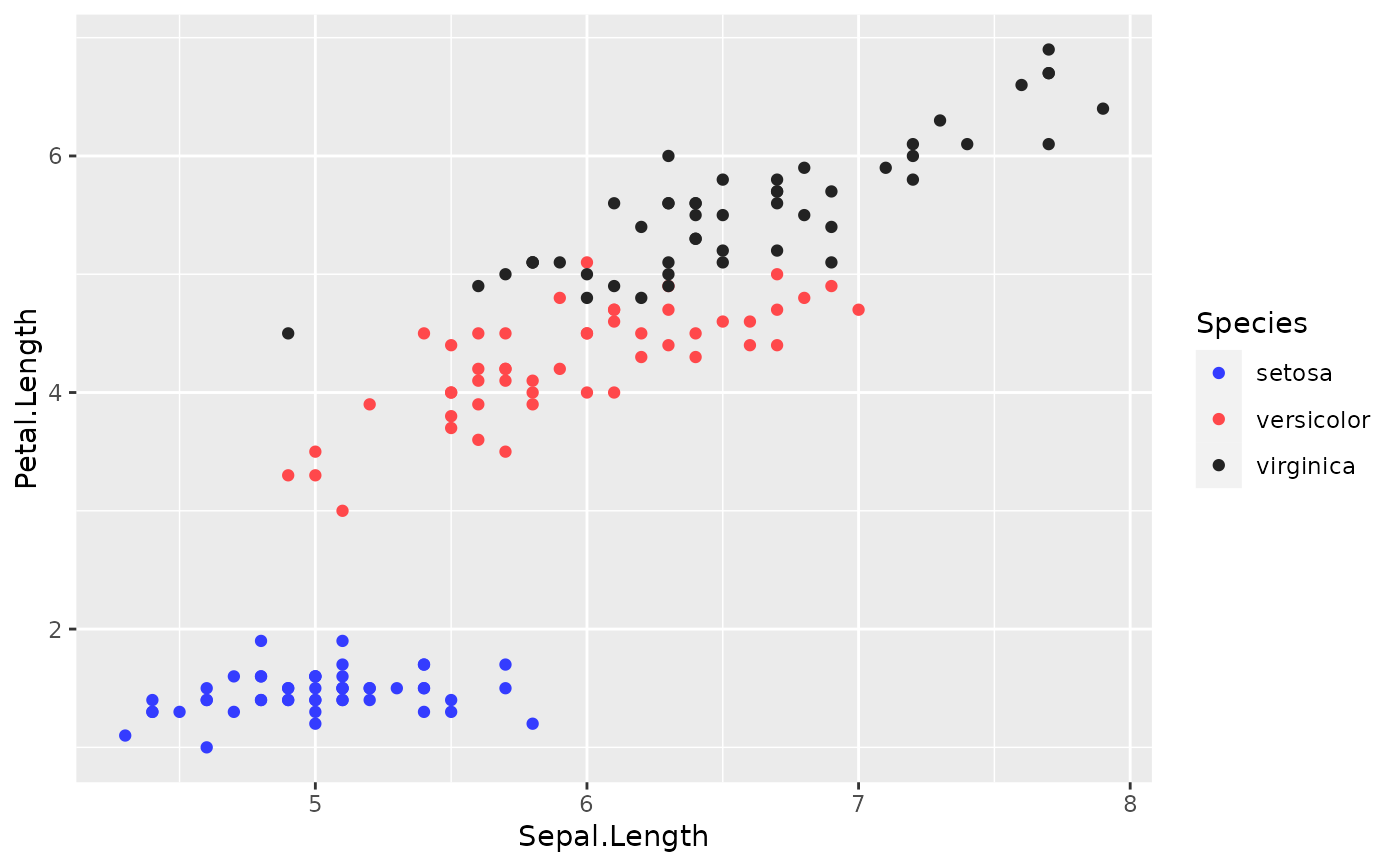
 ## with \code{ggplot2}
library(ggplot2)
p_gg <- with(iris, qplot(Sepal.Length, Petal.Length, col = Species))
p_gg
## with \code{ggplot2}
library(ggplot2)
p_gg <- with(iris, qplot(Sepal.Length, Petal.Length, col = Species))
p_gg
 p <- ggplotGrob(p_gg)
grid.newpage()
grid.draw(
decorate_grob(
grob = p,
titles = titles,
footnotes = footnotes,
page = "Page 6 of 129"
)
)
p <- ggplotGrob(p_gg)
grid.newpage()
grid.draw(
decorate_grob(
grob = p,
titles = titles,
footnotes = footnotes,
page = "Page 6 of 129"
)
)
 ## with \code{lattice}
library(lattice)
xyplot(Sepal.Length ~ Petal.Length, data = iris, col = iris$Species)
## with \code{lattice}
library(lattice)
xyplot(Sepal.Length ~ Petal.Length, data = iris, col = iris$Species)
 p <- grid.grab()
 grid.newpage()
grid.draw(
decorate_grob(
grob = p,
titles = titles,
footnotes = footnotes,
page = "Page 6 of 129"
)
)
grid.newpage()
grid.draw(
decorate_grob(
grob = p,
titles = titles,
footnotes = footnotes,
page = "Page 6 of 129"
)
)
 # no borders
library(gridExtra)
#>
#> Attaching package: ‘gridExtra’
#> The following object is masked from ‘package:dplyr’:
#>
#> combine
grid.newpage()
grid.draw(
decorate_grob(
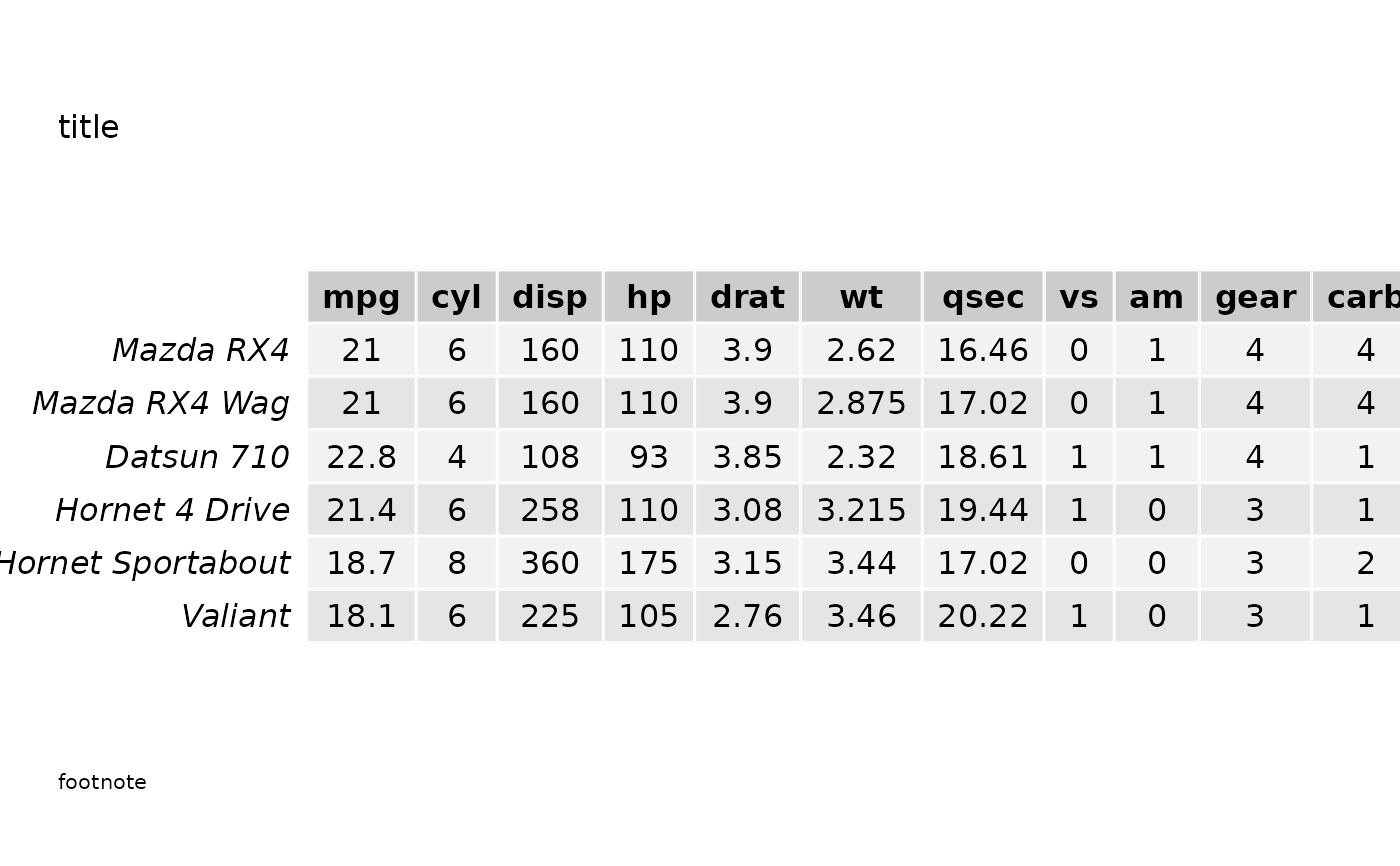
tableGrob(
head(mtcars)
),
titles = "title",
footnotes = "footnote",
border = FALSE
)
)
# no borders
library(gridExtra)
#>
#> Attaching package: ‘gridExtra’
#> The following object is masked from ‘package:dplyr’:
#>
#> combine
grid.newpage()
grid.draw(
decorate_grob(
tableGrob(
head(mtcars)
),
titles = "title",
footnotes = "footnote",
border = FALSE
)
)