Arguments
- ylab
(
gtable)
the y-lab as a graphical object derived from aggplot.- yaxis
(
gtable)
the y-axis as a graphical object derived from aggplot.
Examples
# \donttest{
library(dplyr)
library(survival)
library(grid)

fit_km <- tern_ex_adtte %>%
  filter(PARAMCD == "OS") %>%
  survfit(formula = Surv(AVAL, 1 - CNSR) ~ ARMCD, data = .)
data_plot <- h_data_plot(fit_km = fit_km)
xticks <- h_xticks(data = data_plot)
gg <- h_ggkm(
  data = data_plot,
  censor_show = TRUE,
  xticks = xticks, xlab = "Days", ylab = "Survival Probability",
  title = "title", footnotes = "footnotes", yval = "Survival"
)

g_el <- h_decompose_gg(gg)

grid::grid.newpage()
pvp <- grid::plotViewport(margins = c(5, 4, 2, 20))
pushViewport(pvp)
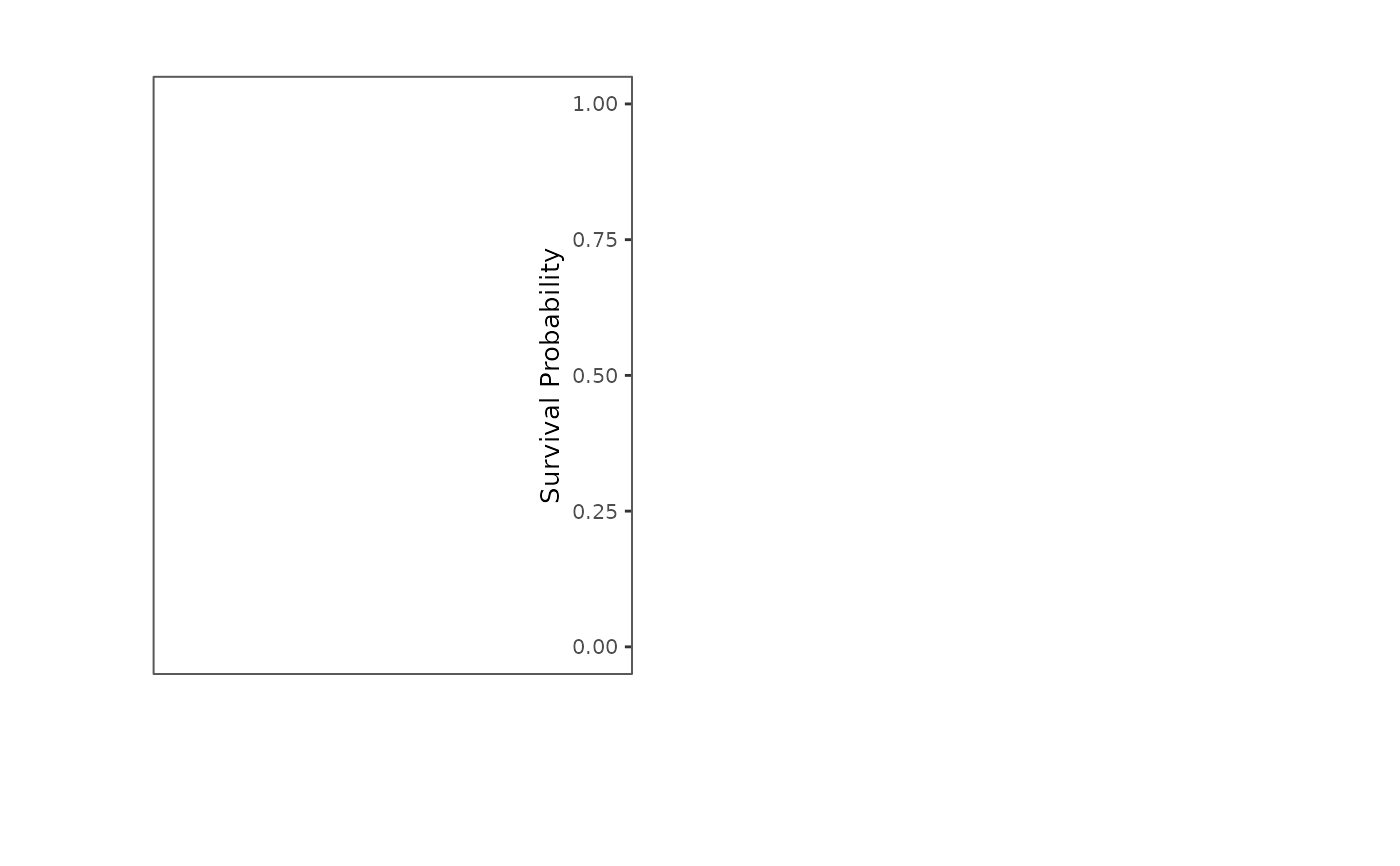
grid::grid.draw(h_grob_y_annot(ylab = g_el$ylab, yaxis = g_el$yaxis))
#> Warning: `h_grob_y_annot()` was deprecated in tern 0.9.4.
#> ℹ `g_km` now generates `ggplot` objects. This function is no longer used within
#>   `tern`.
grid.rect(gp = grid::gpar(lty = 1, col = "gray35", fill = NA))

# }
# }
