Arguments
- x
(
numeric)
vector of numbers we want to analyze.- y
(
numeric)
vector of numbers we want to analyze, to be compared withx.- conf_level
(
proportion)
confidence level of the interval.
Value
s_bland_altman()returns a named list of the following elements:df,difference_mean,ci_mean,difference_sd,difference_se,upper_agreement_limit,lower_agreement_limit,agreement_limit_se,upper_agreement_limit_ci,lower_agreement_limit_ci,t_value, andn.
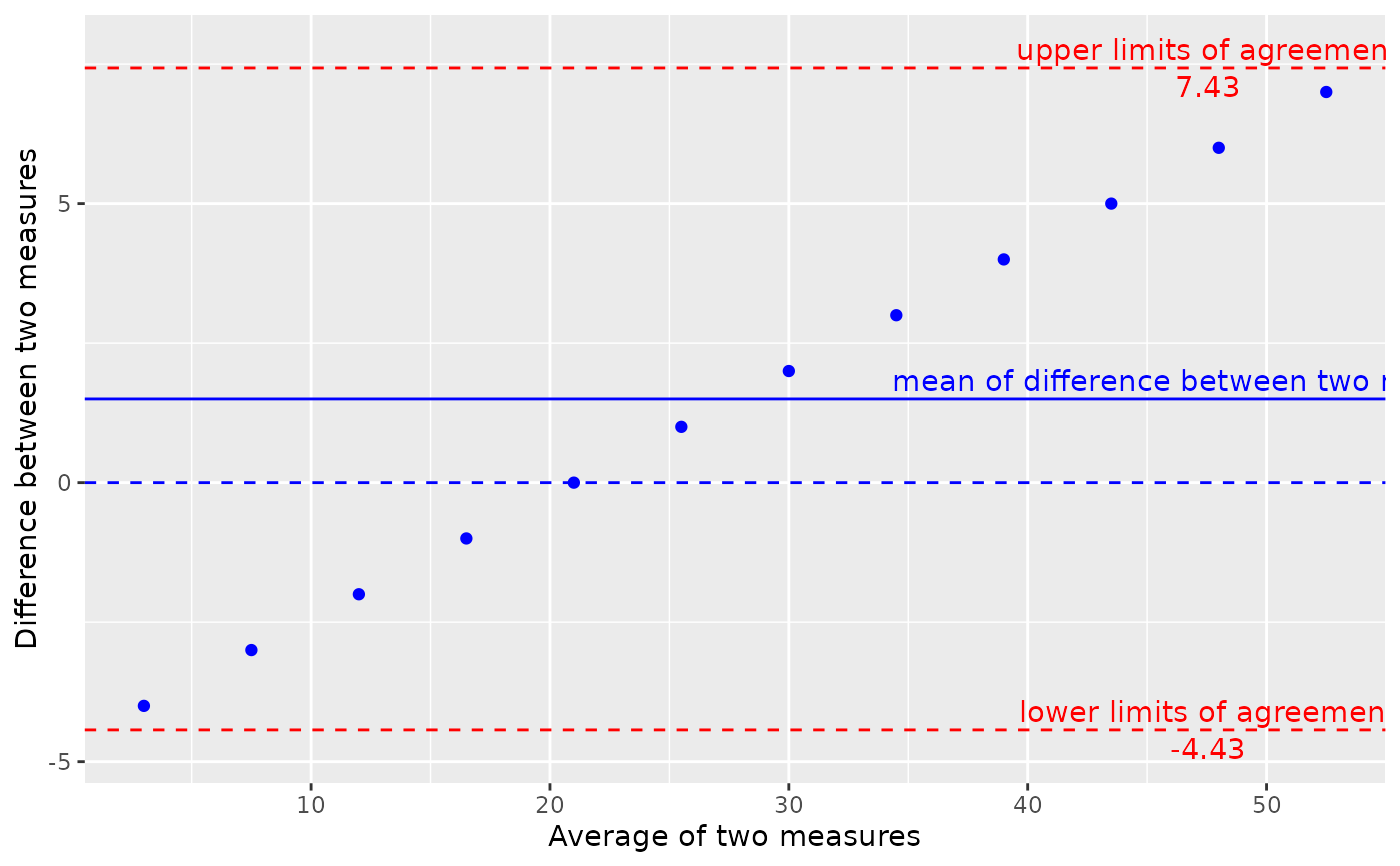
g_bland_altman()returns aggplotBland-Altman plot.
Functions
s_bland_altman(): Statistics function that compares two numeric vectors using the Bland-Altman method and calculates a variety of statistics.g_bland_altman(): Graphing function that produces a Bland-Altman plot.
Examples
x <- seq(1, 60, 5)
y <- seq(5, 50, 4)
conf_level <- 0.9

# Derive statistics that are needed for Bland-Altman plot
s_bland_altman(x, y, conf_level = conf_level)
#> $df
#>    average difference
#> 1      3.0         -4
#> 2      7.5         -3
#> 3     12.0         -2
#> 4     16.5         -1
#> 5     21.0          0
#> 6     25.5          1
#> 7     30.0          2
#> 8     34.5          3
#> 9     39.0          4
#> 10    43.5          5
#> 11    48.0          6
#> 12    52.5          7
#>
#> $difference_mean
#> [1] 1.5
#>
#> $ci_mean
#> [1] -0.3692162  3.3692162
#>
#> $difference_sd
#> [1] 3.605551
#>
#> $difference_se
#> [1] 1.040833
#>
#> $upper_agreement_limit
#> [1] 7.430604
#>
#> $lower_agreement_limit
#> [1] -4.430604
#>
#> $agreement_limit_se
#> [1] 1.802776
#>
#> $upper_agreement_limit_ci
#> [1]  4.193027 10.668181
#>
#> $lower_agreement_limit_ci
#> [1] -7.668181 -1.193027
#>
#> $t_value
#> [1] 1.795885
#>
#> $n
#> [1] 12
#>

# Create a Bland-Altman plot
g_bland_altman(x = x, y = y, conf_level = conf_level)

