![[Stable]](figures/lifecycle-stable.svg)
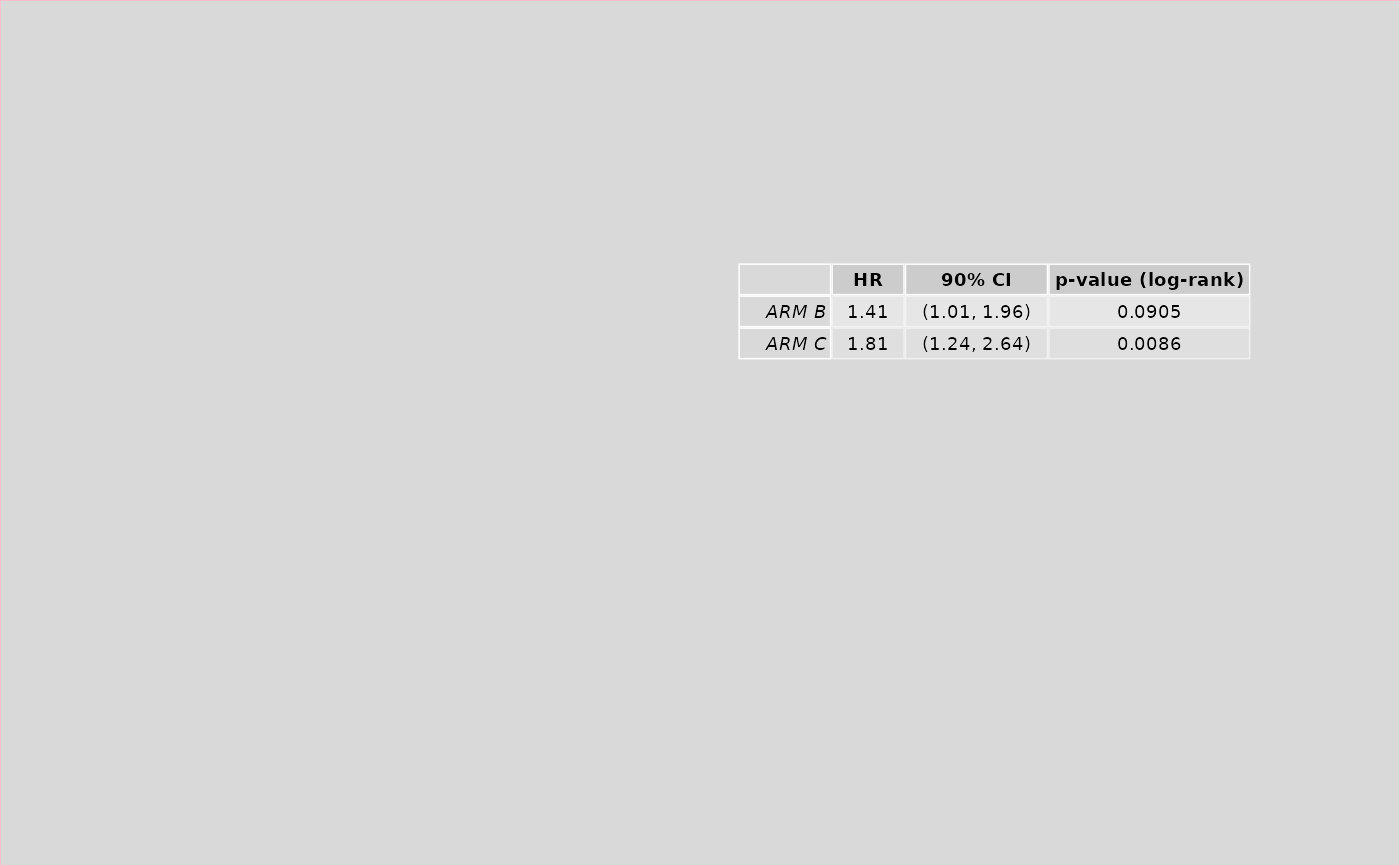
Grob of rtable output from h_tbl_coxph_pairwise()
Arguments
- ...
arguments will be passed to
h_tbl_coxph_pairwise().- x
(
numeric)
a value between 0 and 1 specifying x-location.- y
(
numeric)
a value between 0 and 1 specifying y-location.- width
(
unit)
width (as a unit) to use when printing the grob.- ttheme
(
list)
seegridExtra::ttheme_default().
Value
A grob of a table containing statistics HR, XX% CI (XX taken from control_coxph_pw),
and p-value (log-rank).
Examples
# \donttest{
library(dplyr)
library(survival)
library(grid)

grid::grid.newpage()
grid.rect(gp = grid::gpar(lty = 1, col = "pink", fill = "gray85", lwd = 1))
data <- tern_ex_adtte %>%
  filter(PARAMCD == "OS") %>%
  mutate(is_event = CNSR == 0)
tbl_grob <- h_grob_coxph(
  df = data,
  variables = list(tte = "AVAL", is_event = "is_event", arm = "ARMCD"),
  control_coxph_pw = control_coxph(conf_level = 0.9), x = 0.5, y = 0.5
)
grid::grid.draw(tbl_grob)

# }
# }